When you see something classed as “Five Stars”, what do you think it means? I bet it’s something like “The best you can buy”. That seems to work for Hotels, Sandwiches, Restaurants and the like. But not, it seems, for something as important as Car Safety, where the difference between the various levels of crash resistance can, literally, mean the difference between Life and Death – and Your Life and Death at that.
The Department for Transport has issued a couple of intriguing reports recently, which have set my mind wandering on this subject. Having spent most of my working life in the vehicle industry, I have watched the way politics and car design interact, with more than just a passing interest. One area which has fascinated me for some time has been the way Governments have approached vehicle safety, and in particular the NCAP tests, which now get such prominence in car advertising. Anything less than 5 stars today is seen as a failure whenever a new vehicle is introduced.
The niggle that has always been there in my mind is simple. How can a big car get five stars and a little car, with much less metal in it, and everything in it being much closer to the squashy bits of the occupants inside, also get five stars. The simple answer is that ***** is not an absolute measure of safety – it’s a relative one, dependant upon the size of the car. A rating of ***** in a small car does not give the same level of protection to the occupants as ***** in a larger car – it’s relative to other cars in its class.
Now I’m a simple person, but I’m not sure that this situation is made at all clear to anyone buying a new vehicle, and something inside me says that there could easily here be a policy of confusion produced by someone to keep this issue unclear. Safety in a car is what I would call “binary” – to me, if you have a crash, you are entitled to think that if you buy a car with a ***** ratings, then you are buying the safest car you can possibly buy – unfortunately Not True. The reality is that a larger vehicle, quite possibly with a 4 Star rating, could easily turn out to be much safer in a crash than a smaller vehicle with a 5 Star rating.
If you equate difficulty to find information with the aim of keeping a degree of confusion and uncertainty going, then the government agencies are also a little coy about this. If you read the small print in their documents, you will find a note that is presumably meant to address this issue, but it is writ very small, and is not at all helpful in the explanation it offers. It’s the sort of thing their lawyers would insist on being included, but only after the Marketing Spin Merchants have woven their spells on the language, so it doesn’t actually tell you anything. So when you look to find out how safe in the real world a big car is compared to a little one, you do not find our Lords and Masters being over zealous and overforthcoming with the answers. In fact until now, you had a bit of a task on your hands to get any solid information at all.
But now, the Department for Transport has issued a report which lifts the carpet a bit on this – and it makes for interesting reading. In a report called “Cars: Make and Model: The Risk of Driver Injury in Great Britain: 2000 – 2004”, they have analysed all reported car accidents involving 2 cars between 2000 and 2004, and the report presents their findings.
Rather than go into the 30 pages of information, let’s look at the really important questions. I suspect that everyone who drives on the road would expect to receive some form of injury, slight though it may be, if they were in an accident. Common sense says it goes with the territory. What I suspect is really important to people is the likelihood of receiving a serious injury, or even being killed in a car accident. So let’s concentrate on this area.
If you look beyond the statistical “standardisations” and caveats in the report, the risk of having a Fatal or Serious Injury in a 2 car accident is as follows –
Small/Low Sports cars - 6%
Small cars - 7%
Small/medium cars - 6%
Medium cars - 5%
Large cars - 4%
MPVs - 4%
Four wheel Drives - 3%
All cars - 5%
Now, I guess Common Sense (that particularly rare commodity) would see those figures as reasonable and sensible. Those of us who have studied Physics, and can remember such things as the Law of Conservation of Angular Entropy or whatever it's called (see, it’s all coming back to me now, even after 40 years) will agree that when a big thing hits a small thing travelling in the opposite direction, it’s usually the small thing which comes off worst, and that’s what the data seems to be supporting. But if we look a little closer, there are a few things which seem also to be clear, but which you seem to have to work out for yourself.
In the small car category, the Rover Mini (emphatically not the new one) is the most dangerous car they measured, at 14%, twice the class average, and the Citroen C3, is at 3%, more than 50% better than the class average. That’s less than 25% as potentially dangerous, one car versus the other. Interestingly, in its class, the C3 only gets 4 Stars in the NCAP tests. The Nissan Micra (1993-2003) is rated at 4 stars, and suffers an 8% Killed or Serious Accident rate, whereas the C3, the Mercedes A Class, and the latest Polo’s figures (all also rated at 4 Stars) are all 4% or less – 50% better for the same rating.
As you get up to the larger ranges of cars, the variation between models become much less marked. For instance, in the Medium car category, the Killed or Seriously Injured range is between 3% and 7% (excluding the Subaru Impreza at 8%, and that, I suspect would have something to do with the type of drivers it attracts).
In the Large car class, for vehicle which are available today, the range narrows again to 2% - 4%. Once again, Common Sense coming good.
The one which must get up many people’s nose is the 4 wheel drive category. Here, the average risk is the lowest of all those measured, at 3%, which once again makes logical sense. You only have to imagine a Mercedes ML Class hitting something like a 2004 Clio, and the fact that the Clio comes off 5 times as badly comes as no surprise. Except that they both got 4 Star ratings in the NCAP tests.
The 4WD category includes a range of large and small 4WDs, and if you do a broad split of the list into large 4WDs and small 4WDs, the difference between them becomes even more intriguing. Within the 3% overall average, the smaller 4WDs have a 3.8% risk, whereas the larger ones are less than 1.6% - twice as good as any other section of the vehicle population. Hmmm!
Now, I know only too well that these Government statistics are measuring a lot of things which the NCAP tests are not measuring – the type of driver, the weight of the other vehicle the cars hit, the Primary vehicle safety characteristics (ie the ability of the car NOT to get into an accident in the first place), the inherent randomness of vehicle accidents and so on. But, these figures seem to show the much maligned 4WD vehicle in a different light. Now there are American statistics which show just how important the weight of a vehicle is in a crash, and, once again, it is not surprising that driving around in a large 4WD vehicle, and hitting a smaller car is likely to mean the 4WD occupants are safer – much safer. But no-one in this country seems to make this point as a balance to the “Destruction of the Planet” argument.
It’s a bit like the MMR argument – you may not want to risk your own child by giving them the injections, but you want to be covered by the immunity created by everyone else having theirs inoculated. Your car accident risk will be low as long as most of the other cars on the road are smaller and lighter – so buy the big one and hope that any accident you have is with a smaller vehicle. You can argue it’s not morally right, but how do you convince people not to buy into an unfair advantage, when the benefit their money buys may well be - Staying alive.
To further this point, there is an interesting little statistical Table tucked away at the back of the report, which seems to have escaped comment in the body of the report. Rather than measure risk of Fatal or Serious Injury combined, as all the figures above attempt to do, they pull out the chance of being Killed in each type of vehicle.
The average chance of being Killed in ALL accidents they measured was 0.3%. The figure, if you were in a Small car or Sports car, was 0.5% (70% higher) and for MPVs and 4WDs, the figure was Less than 0.01%.
That’s 30 times less than the average, and 50 times less than a small car.
So now what sort of car do you buy next time?
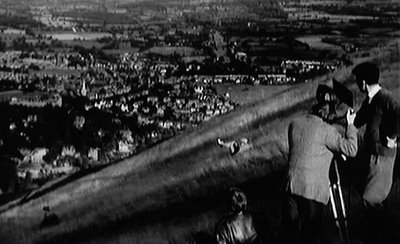
 THE HITLER OAK BEING PLANTED AT BEDFORD - 1936
 Harold Abrahams – immortalised in David Puttnam’s film “Chariots of Fire” as the winner of the sprint in the 1924 Olympics
 Dan Wheldon – Britain’s most successful Racing Driver over the last few years, but you haven’t heard of him because all his success is in the USA. Won the Indianapolis 500, and the last Brits with their name on that trophy were Jim Clark and Graham Hill – you wouldn’t mind following on from those two geniuses!
 Alistair Cook – Cricketer - Left handed Batsman who played so brilliantly against Pakistan in 2006, before someone “tampered with the ball"


